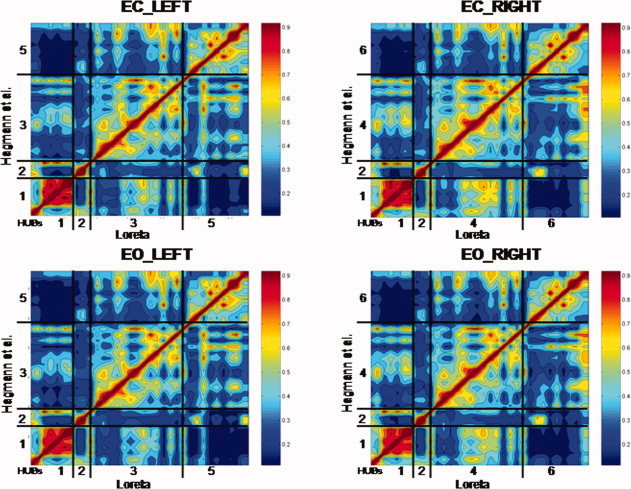
Figure 2.

Contour maps of showing the results of the temporal correlation analysis between all possible combinations of the 33 LORETA ROIs in each hemisphere. The y‐axis are the six Hagmann et al. [2008] Modules and the x‐axis are the LORETA ROIs corresponding to the Hagmann Modules shown in Table I. The diagonal is the correlation of ROIs with themselves [r = 1.0]. The null‐hypothesis is that the off‐diagonal elements are randomly correlated and do not show any ordering. Instead the off‐diagonal elements show a strong correspondence to the six Hagmann et al. [ 2008] Modules using LORETA. The color scale to the right of each contour plot is the magnitude of temporal source correlation between LORETA ROIs. Example is from the theta frequency band and the numerical results are shown in Table IV. EC, eyes closed; EO, eyes open conditions. [Color figure can be viewed in the online issue, which is available at wileyonlinelibrary.com.]
