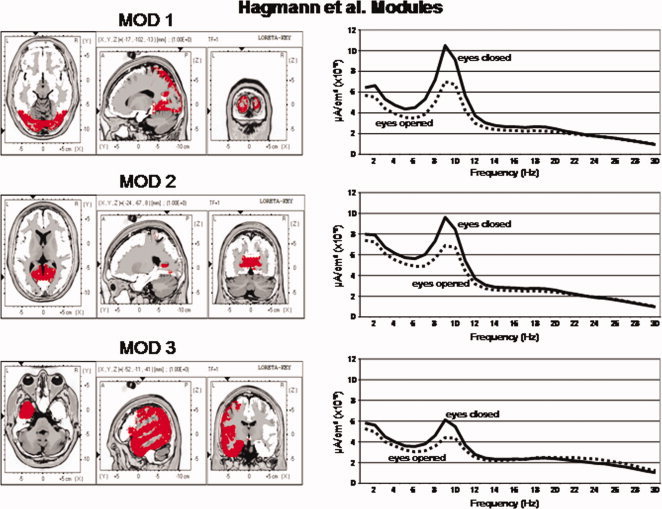
Figure 3.

Left are the voxel locations of the Hagmann et al. [ 2008] Modules 1 to 3 as shown in Figure 1. Right are the power spectra of the average LORETA currents from the ROIs constituting Hagmann Modules 1 to 3. The y‐axis is current in uA/cm2 and the x‐axis is frequency from 1 to 30 Hz. The solid lines are the eyes closed condition and the dashed lines are the eyes open condition. Solid lines = eyes closed condition and dashed lines = eyes open. [Color figure can be viewed in the online issue, which is available at wileyonlinelibrary.com.]
