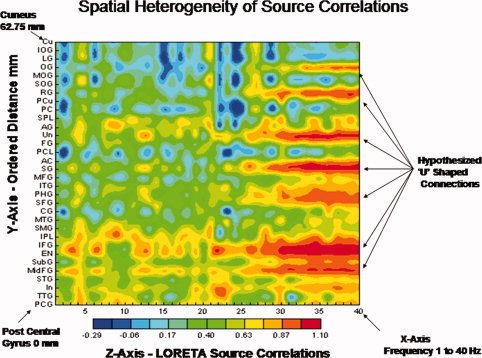
Figure 7.

From Thatcher et al. [ 2007] and an exemplar of one of the subjects in this study demonstrating spatial heterogeneity of LORETA source correlations which can not be explained by volume conduction. All subjects in this study exhibited similar spatially heterogeneous LORETA source correlations [see Thatcher et al., 2007 for further details]. The two‐dimensional contour map of the LORETA source correlations are ordered as a function of distance from a reference Brodmann area. The regions of interest (ROIs) are ordered from the left post central gyrus (Brodmann area (1) to the left cuneus (Brodmann area 17 that is 62.75 mm distant). The x‐axis is frequency (1–40 Hz), the y‐axis are regions of interest (ROIs) and the regions of interest are ordered as a function of distance from the post central gyrus. The z‐axis is the magnitude of the LORETA source correlation as represented by the color bar of the contour map. PCA, posterior pentral gyrus; TTG, transverse temporal gyrus; In, insula; STG, superior temporal gyrus; MdFG, middle frontal gyrus; Sub G, sub gyral region; EN, extra‐nuclear frontal gyrus; IFG, inferior frontal gyrus; IPL, inferior parietal lobule, SMG, supramaginal gyrus; MTG, middle temporal gyrus; CG, cingulate gyrus; SFG, superior frontal gyrus; PHG, parahippocampal gyrus; ITG, inferior temporal gyrus; MFG, medial frontal gyrus; SG, subcallosal gyrus; AC, anterior cingulate; PCL, paracentral lobule; FG, fusiform gyrus; UN, uncus; AG, angular gyrus; PC, posterior cingulate; PCu, precuneus; RG, rectal gyrus; SOG, superior occipital gyrus; MOG, middle occipital gyus; OG, orbital gyrus; LG, lingual gyrus; IOG, inferior occipital gyrus; Cu, cuneus. [Color figure can be viewed in the online issue, which is available at wileyonlinelibrary.com.]
