
Figure 7.
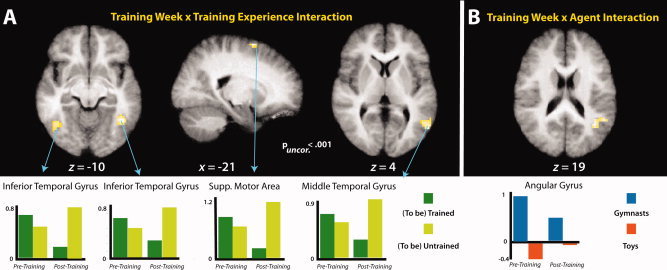
Panel A illustrates the interaction between training week (pretraining; posttraining) and training experience (trained; untrained). Panel B illustrates the interaction between training week (pretraining; posttraining) and agent (gymnasts; toys). T‐Maps are thresholded at t > 3.53. The bar graphs illustrate parameter estimates from all clusters that reached a significance value of p (uncorrected) < 0.001. [Color figure can be viewed in the online issue, which is available at wileyonlinelibrary.com.]