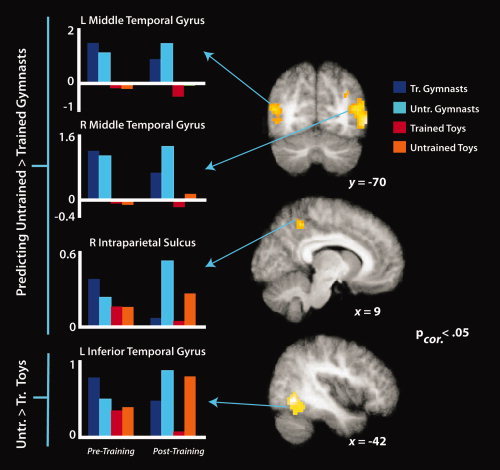
Figure 9.

Simple effects imaging results for predicting untrained compared to trained gymnastic sequences (top two brains and three plots) and untrained compared to trained wind‐up toy sequences (lower brain and plot), evaluated during the posttraining scan session. t‐Maps are thresholded at t > 4.9, P < 0.06, FDR‐corrected (the left occipitotemporal activation reached marginal cluster‐corrected significance at P = 0.06; all other regions are FDR‐corrected P < 0.05). Parameter estimates were extracted from each cluster from both the pretraining and posttraining scan sessions and are plotted to the left of the t‐maps for illustration purposes only.
