
Figure 4.
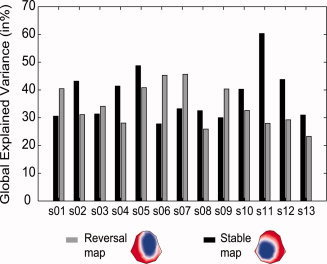
Global presence of the template maps. Bars indicate the percentage of Global Explained Variance of the Reversal (light gray) and Stable (dark gray) map in each individual subject. [Color figure can be viewed in the online issue, which is available at wileyonlinelibrary.com.]