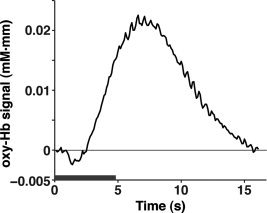
Figure 5.

The averaged time course of oxy‐Hb signal changes in all the measurement channels for the three conditions. The time courses of the 3‐ and 6‐month‐old infants are averaged. The gray bar indicates the period during which the auditory sequences were presented (4.8 s).
