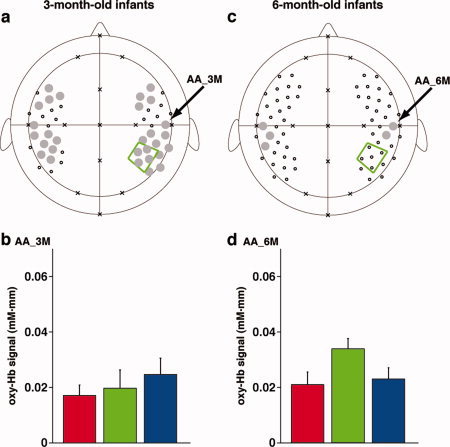
Figure 6.

The cortical activation under the three conditions in the 3‐ and 6‐month‐old infants. (a) The regions revealed by the conjunction analyses of activation for the long, short, and random sequences in the 3‐month‐old infants. We used the time from 5.0 to 9.3 s after the onset of the stimulus for analyses. The gray‐filled circles indicate the channels that surpassed the statistical thresholds under all three conditions. Small open circles indicate measurement channels that did not show significant activation. An arrow indicates the right auditory area (AA_3M) in the temporal region. (b) Oxy‐Hb signal changes in the AA_3M. The red, green, and blue bars indicate the mean signal changes for the long, short, and random sequences, respectively. Error bars show the standard error for each test condition. (c) The regions revealed by the conjunction analyses of activation in the 6‐month‐old infants. The right auditory area (AA_6M) in the temporal region, which is the same channel as AA_3M, is indicated by an arrow. (d) Oxy‐Hb signal changes in AA_6M. The red, green, and blue bars represent the mean signal changes for the long, short, and random sequences, respectively. Error bars show the standard error among all subjects.
