
Figure 4.
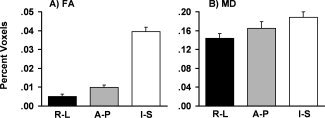
A depiction of how motion in the A‐P axis affected fibers oriented in the right‐left (R‐L, black bars), anterior‐posterior (A‐P, grey bars), or inferior‐superior (I‐S, white bars) direction during the tract‐based spatial statistics analyses. A represents a percentage of significant voxels from the fractional anisotropy analyses (FA) and B represents the voxels from the mean diffusivity (MD) analysis. Error bars represent one standard deviation.