Figure 2.

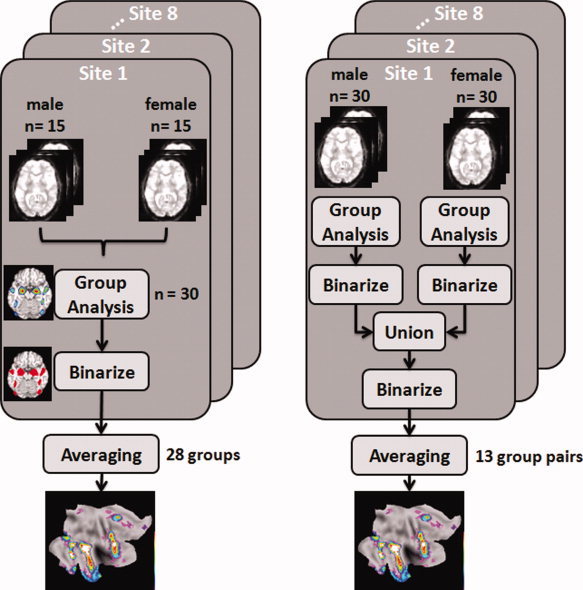
Flowchart illustration of the procedure for creating two types of functional probabilistic maps using functional data from eight acquisition sites: Left: sex combined at entry; and Right: sex combined after sex‐specific analyses.

Flowchart illustration of the procedure for creating two types of functional probabilistic maps using functional data from eight acquisition sites: Left: sex combined at entry; and Right: sex combined after sex‐specific analyses.