
Figure 3.
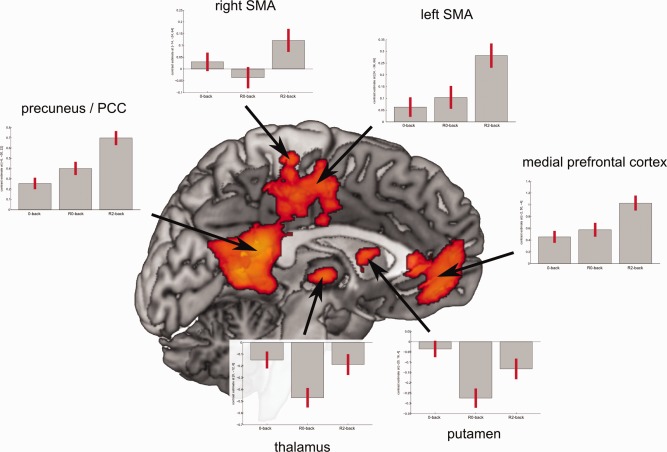
Parameter estimates for areas significantly more activated in the baseline period after 2‐back (B2‐back) compared with the baseline period after 0‐back (B0‐back). Gray bars represent average parameter estimate for the given regressor, red lines depict 90% confidence interval. [Color figure can be viewed in the online issue, which is available at http://wileyonlinelibrary.com.]