
Figure 10.
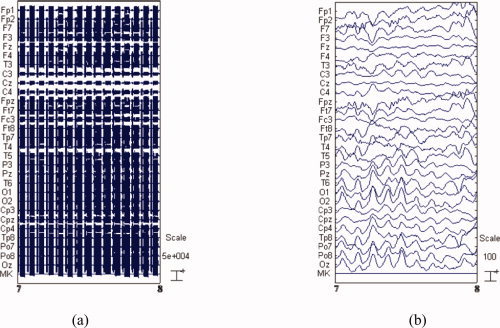
Raw EEG and artifact‐removed EEG. (a) 1 s raw EEG data collected during simultaneous EEG/fMRI, (b) the same traces after band‐pass filtering and image artifact attenuation using AAS. [Color figure can be viewed in the online issue, which is available at wileyonlinelibrary.com.]