
Figure 3.
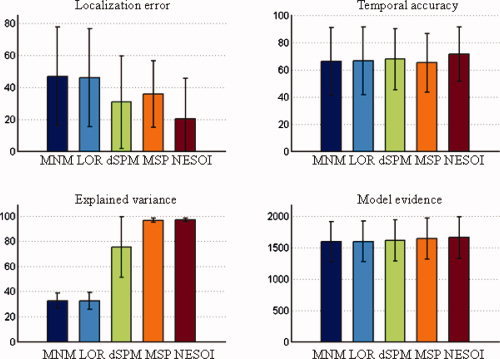
Mean value and standard deviation of the four evaluation metrics for the five methods: MNM, LOR, dSPM, MSP, and NESOI, respectively. Upper panels: Localization error (left) and temporal accuracy (right); lower panels: Explained variance (left) and model evidence (right). [Color figure can be viewed in the online issue, which is available at wileyonlinelibrary.com.]