
Figure 4.
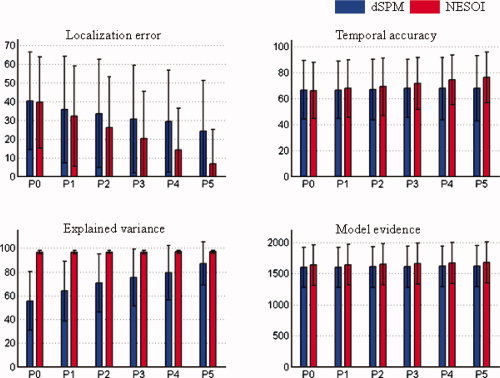
Mean value and standard deviation of evaluation metrics for dSPM and NESOI in different levels of concordance between EEG and fMRI. Upper panels: localization error (left) and temporal accuracy (right). Lower panels: explained variance (left) and model evidence (right). The number of valid priors varies from zero (P0) to five (P5), corresponding complete discordance or complete concordance between EEG and fMRI. [Color figure can be viewed in the online issue, which is available at wileyonlinelibrary.com.]