
Figure 6.
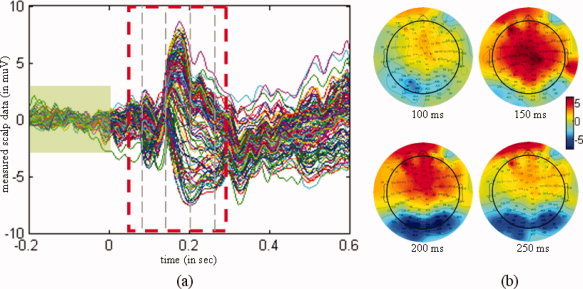
Differential ERPs for faces and scrambled faces. (a) Waveform of the ERPs, with a dashed rectangle depicting the actual time interval for analyzing. The scalp measurements exhibited a peak at 170 ms after stimulus onset. The signal masked by the green rectangle was used as a baseline. (b) Topographies of the differential ERPs at 100 ms, 150 ms, 200 ms, and 250 ms after stimulus onset. [Color figure can be viewed in the online issue, which is available at wileyonlinelibrary.com.]