
Figure 7.
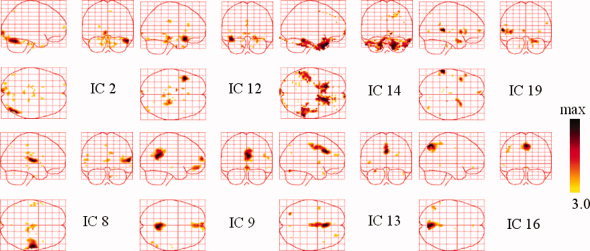
Temporally coherent networks of face perception revealed by ICs. Sagittal, coronal, and axial views of the spatial map are listed for each component. These are scaled to z scores and shown in a maximum intensity projection format. Yellow to black represent z values ranging from 3.0 to max. [Color figure can be viewed in the online issue, which is available at wileyonlinelibrary.com.]