
Figure 8.
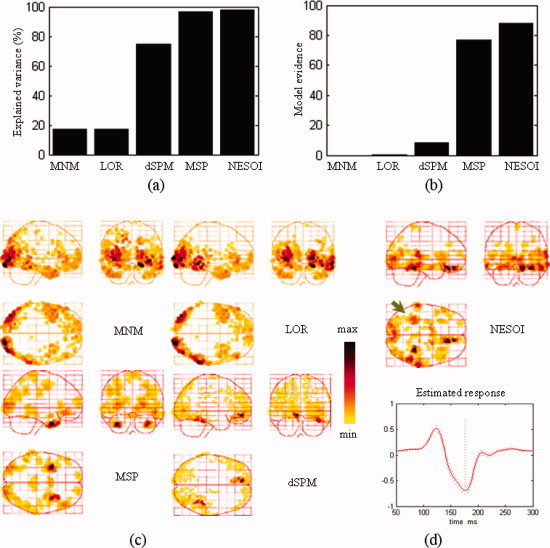
Model comparison among MNM, LOR, dSPM, MSP, and NESOI. (a) Explained variance; (b) Model evidence; (c) Maximum intensity projections of the spatial activities of face perception obtained by MNM, LOR, dSPM, and MSP; (d) The spatial profile and time course obtained by NESOI. [Color figure can be viewed in the online issue, which is available at wileyonlinelibrary.com.]