
Figure 9.
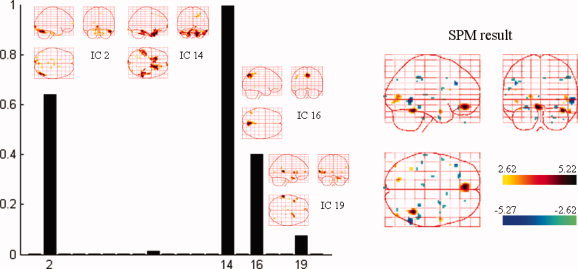
Spatial components that were automatically selected by NESOI and the fMRI SPM result for the same subject. Left panel: Hyperparameter γi estimated for each TCN. IC2, IC14, IC16, and IC19 were selected with support from EEG data having relatively larger hyperparameters. Right panel: SPM statistical result of the same subject within the same paradigm. [Color figure can be viewed in the online issue, which is available at wileyonlinelibrary.com.]