
Figure 2.
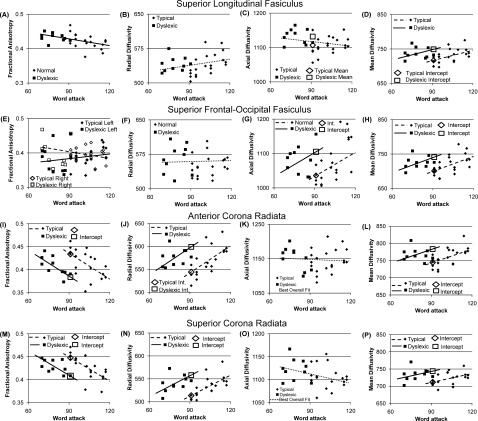
Relations between performance on reading‐related tasks, history of dyslexia, and white matter microstructure indices of (A,E,I,M) fractional anisotropy, (B,F,J,N) Radial Diffusivity, (C,G,K,O) Axial Diffusivity, and (D,H,L,P) Mean Diffusivity for the (A‐D) superior longitudinal fasciculus, (E‐H) superior frontal‐occipital fasiculus, (I‐L) anterior corona radiata and (M‐P) superior corona radiata. The microstructure values are averaged across hemispheres for all graphs except (E). Reading group differences are depicted by intercept differences which are shown as an open diamond and open square for typical and poor readers respectively. Diffusivity units are μm2/sec × 10−3.