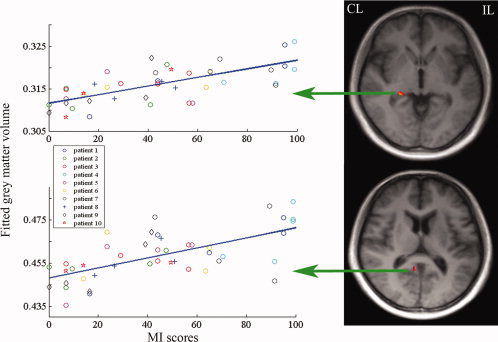
Figure 4.

Brain regions with significant correlation between gray matter volume and MI scores. These brain areas are overlaid on slices of the averaged T1‐weighted images of all stroke patients, including the contralesional hippocampus (peak voxel x = 25, y = −34, z = −3, cluster size 135 voxels, z = 4.97, P < 0.001, uncorrected) and the contralesional precuneus (peak voxel x =7, y = −50, z = 11, cluster size 143 voxels, z = 4.14, P < 0.001, uncorrected). For the correlation map, the x‐axis represents MI scores at each time point after stroke, and the y‐axis denotes the mean gray matter volume of each cluster. CL, contralesional hemisphere; IL, ipsilesional hemisphere. [Color figure can be viewed in the online issue, which is available at wileyonlinelibrary.com.]
