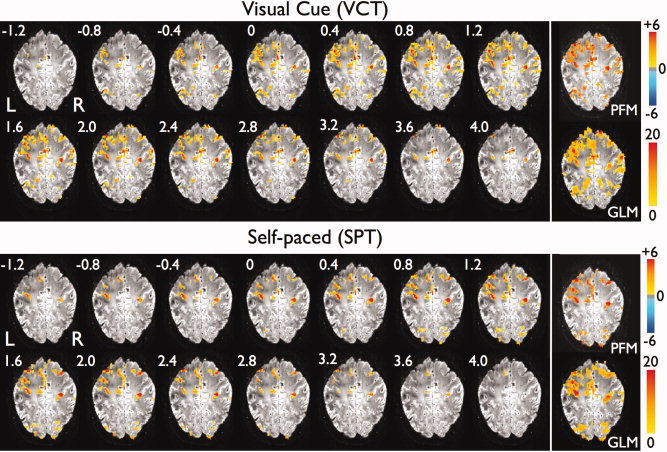
Figure 3.

Time courses of t‐maps (P value < 0.05, FDR‐corrected) showing the activation for the first VCT (top) and first SPT (bottom) for subject A at TR 0.4 s. In addition, the corresponding statistical parametric maps (F‐test, P value < 0.05, FDR‐corrected) after fitting a GLM model with the canonical HRF and the first derivative are shown at the right bottom of each slice sequence (white box). The times are relative to the onset of the tapping as recorded by the EMG signals. [Color figure can be viewed in the online issue, which is available at wileyonlinelibrary.com.]
