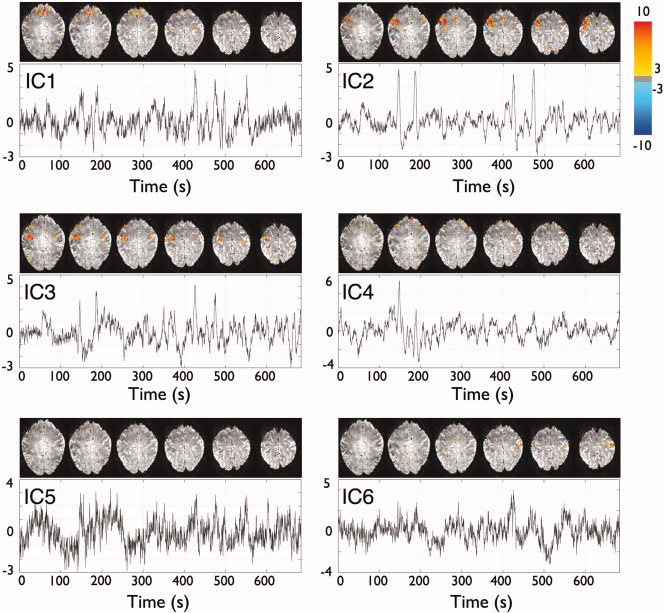
Figure 4.

Spatial probabilistic ICA maps and associated time courses of the relevant components (i.e., those whose correlation coefficient with EMG regressor is > 0.3) for the dataset of subject A at TR 0.4 s (same as Figures 3 and 5). All maps represent Z‐scores (thresholded at Z > 3.0) after normalization of the spatial components with the voxelwise estimated standard error of the residual noise. [Color figure can be viewed in the online issue, which is available at wileyonlinelibrary.com.]
