
Figure 2.
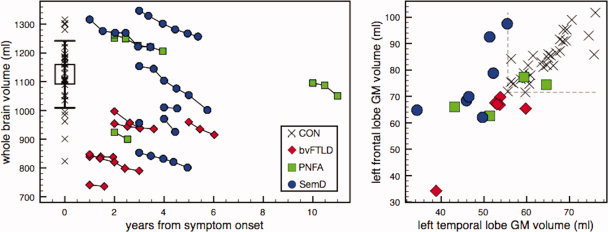
Left subfigure: whole brain volumes (uncorrected for total intracranial volumes) in relation to disease duration. Chains represent individual patients. Black error bar indicates controls' mean ± 1 SD. Right subfigure: TIV‐corrected gray matter volumes of left FL in relation to left TL at baseline per group. Dotted lines represent CON range lower bounds. Black crosses indicate individual control data. [Color figure can be viewed in the online issue, which is available at wileyonlinelibrary.com.]