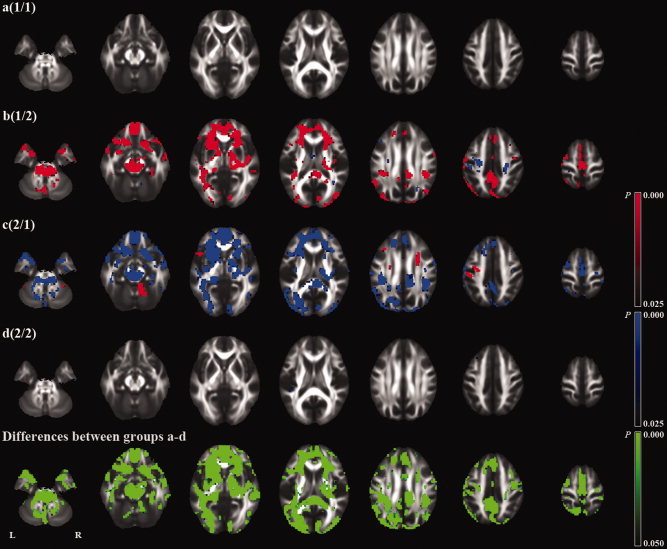
Figure 4.

Voxel‐based analysis (VBA) of longitudinal (1‐year) fractional anisotropy (FA) changes. The first four rows indicate an analysis of each group (a‐d). The fifth row indicates an analysis of differences between groups a, b, c, and d (F test). Red and blue represent an increase and decrease in FA, respectively.
