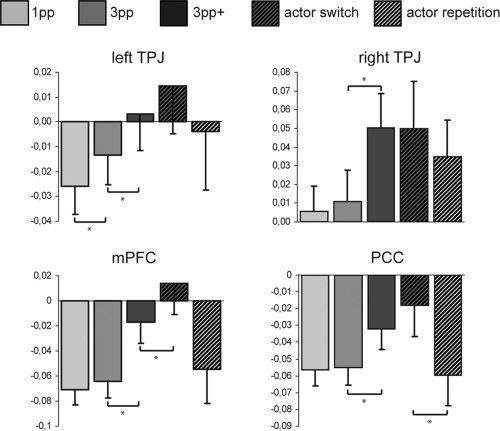
Figure 3.

ROI analysis in ToM regions defined by averaging coordinates of 14 ToM belief studies reported in Van Overwalle and Baetens (2009). Mean beta values were extracted from the contrasts 1pp > rest, 3pp > rest, 3pp+ > rest, actor switch > rest, and actor repetition > rest. Error bars indicate standard error of mean.
