
Figure 3.
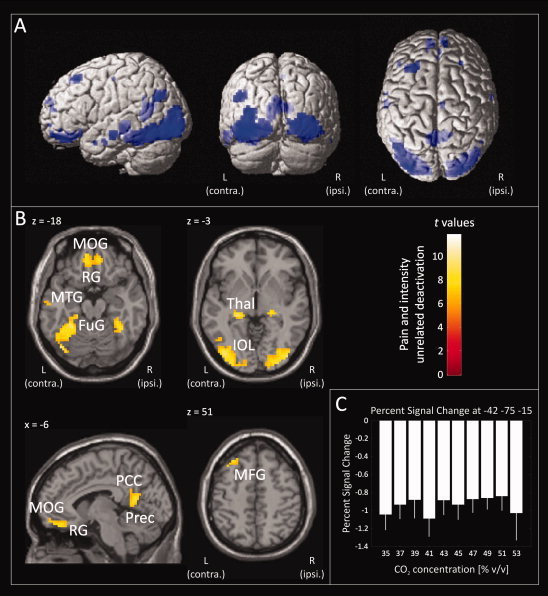
CO2‐stimulus‐related brain deactivation. Brain regions were deactivated irrespective of the stimulus intensity and perception (“CO2 stimulus” regressor, t‐contrast weight: −1). Deactivated regions included the fusiform gyrus (FuG), hippocampus (HipC), inferior occipital lobe (IOL), precuneus (Prec), posterior cingulate cortex (PCC), rectal gyrus (RG), mid orbital gyrus (MOG), thalamus (Thal), middle temporal gyrus (MTG), and middle frontal gyrus (MFG). Statistically significant deactivated voxels (P < 0.05 familywise error corrected) are presented overlaid (blue) on 3D surface renderings of a standard Montreal Neurological Institute brain (Panel A) and as colored overlay on the horizontal and sagittal plane of a structural standard T 1‐weighted MRI template (Panel B; L, Left hemisphere, contralateral to the presentation of the painful stimuli; R, Right hemisphere). The color depth of the displayed voxels reflects the respective t value of the voxel. Furthermore, stimulus related brain activations corresponding to the different CO2 concentrations are reported as mean percent signal change in a 5‐mm spherical search volume around a selected familywise error‐corrected peak coordinate (Panel C; PSC: Colored bars; 90% CI: white error bars). Results reflect a 24‐subject group analysis.