
Figure 10.
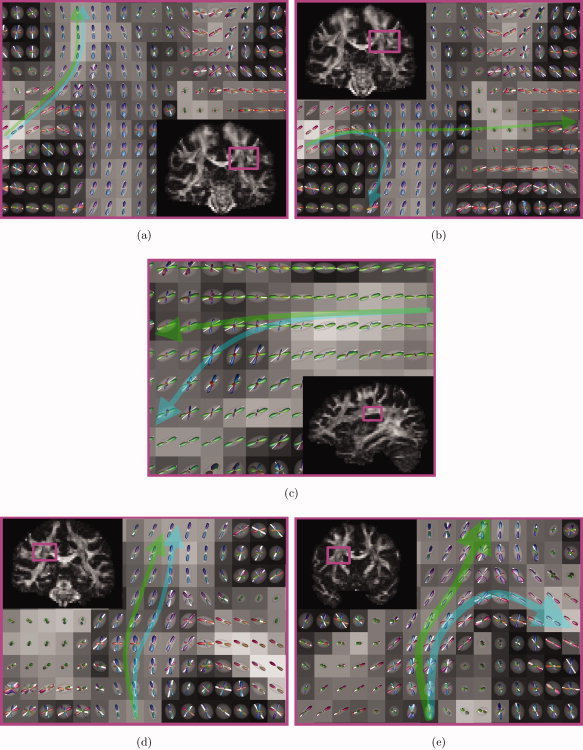
Partial volume effects of DTI in more detail: FA maps with DTI ellipsoids (transparent), first eigenvectors (white lines) and CSD FODs for the trajectories in Figures 6, 7, 8, 6, 7, 8. The arrows are a schematic representation of the probabilistic DTI (blue) and probabilistic CSD (green) trajectories. [Color figure can be viewed in the online issue, which is available at wileyonlinelibrary.com.]