
Figure 1.
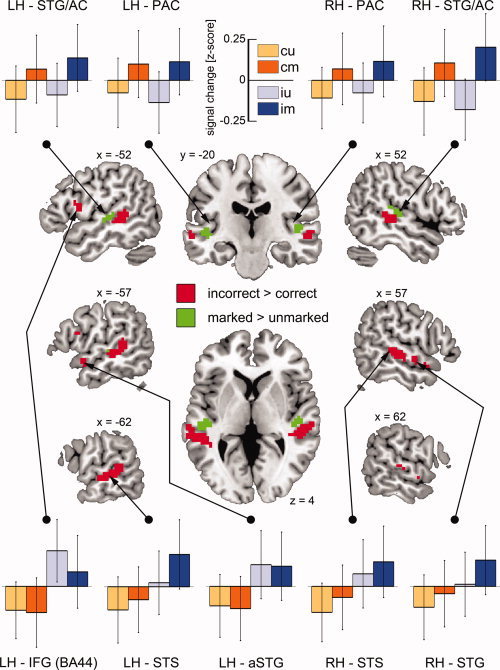
Results of the group analysis for the two univariate contrasts. Center: syntactically incorrect > correct (red, Grammaticality contrast), perceptually marked > unmarked (green, Perceptual markedness contrast), z‐maps thresholded at P ≤ 0.0001 and a cluster extent of k ≥ 8 voxels. Top and Bottom: z‐normalized percent signal change for each ROI and condition (cu—correct unmarked, cm—correct marked, iu—incorrect unmarked, im—incorrect marked) (LH—left hemisphere, RH—right hemisphere, STG—superior temporal gyrus, STS—superior temporal sulcus, IFG—inferior frontal gyrus, PAC—primary auditory cortex, AC—auditory cortex, a—anterior). The error bars reflect the standard error of the mean.