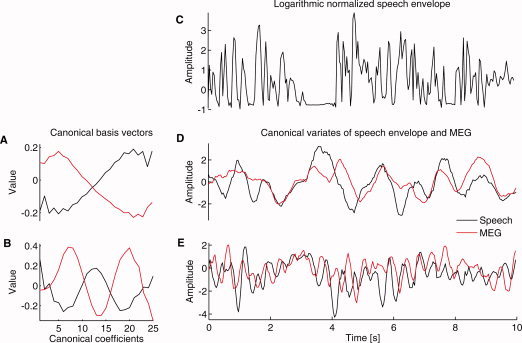
Figure 1.

An example of CCA analysis. Data come from a single gradiometer over the right temporal cortex of Subject #2 who showed the largest correlations in the group. A,B: Two sets of basis vectors are shown. The red lines indicate the MEG and the black lines the speech‐envelope counterparts. The upper pair (A) represents basis vectors sensitive to 0.5 Hz fluctuations and the bottom pair (B) to 2.5 Hz fluctuations. The basis vectors may differ for the two data sources and need not be in the same phase. On the top of the right column (C), a 10‐s piece of the (logarithmic) speech envelope training data is shown. Below (D and E), for the same piece of data, the canonical variables corresponding to the basis vectors on the left are presented. With all training data of this subject, canonical correlation r = 0.37 for the 0.5 Hz fluctuation, and r = 0.26 for the 2.5 Hz fluctuation.
