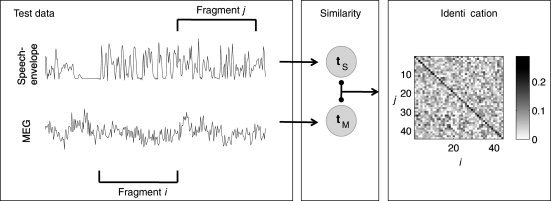
Figure 3.

Schematic illustration of the main identification steps: (i) Canonical variate time series for test data were predicted both for speech envelope data (t S) and for MEG data (t M) and divided into fragments indexed by j for speech and i for MEG. (ii) Correlation was calculated between t M in the fragment i and t S in fragment j. The procedure was repeated for the 30 significant MEG channels. If the median correlation value over the channels was the largest when i = j, the identification was considered correct. The matrix in the figure represents the median correlation values as gray‐scale between fragments i and j when the number of fragments was ∼40. This number was used as a parameter in the identification procedure.
