
Figure 4.
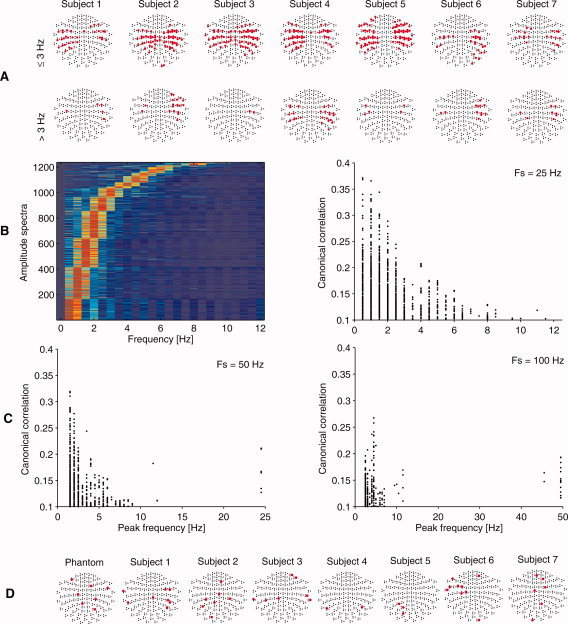
MEG responses to speech, from the classical CCA. A: Topographic maps of 306 MEG sensors (nose upwards). The top panel displays channels responding to AM frequencies ≤ 3 Hz and the bottom panel to > 3 Hz. Statistically significant canonical correlations exceeding 0.1 are marked with red dots. B: Left: The frequency response of the canonical basis vectors of MEG in color scale (arbitrary units), pooled over the seven subjects and sorted by the peak frequency. Right: Pooled correlations as a function of the peak basis vector frequency. In (A) and (B) the results are from data resampled to 25 Hz (sampling frequency Fs; see text for details). C: Corresponding correlations with the two other sampling frequencies. D: MEG channels passing the significance limit in the control data analysis. The maximum correlation of any of these channels was 0.055.