
Figure 5.
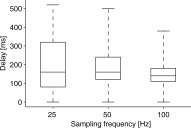
The estimated delays of MEG responses for the three sampling frequencies used, pooled over the channels with significant canonical correlations of the seven subjects. The box‐plot represents the 25th, 50th, and 75th percentiles and the whiskers the extent of data.