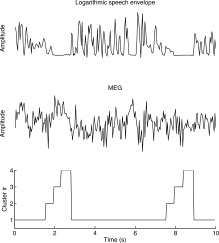
Figure 6.

An example of the dominating cluster estimation. Different clusters here represent different stimulus–response relationships between the speech envelope and one MEG channel. Note that in the figure, one time instant t in the cluster data represents window t − 0.5…t + 0.5 s in the speech and MEG data. Apparently, cluster #1 represents the epochs of sustained speech; the other clusters represent pauses or transition periods from sustained speech to pauses and vice versa.
