
Figure 5.
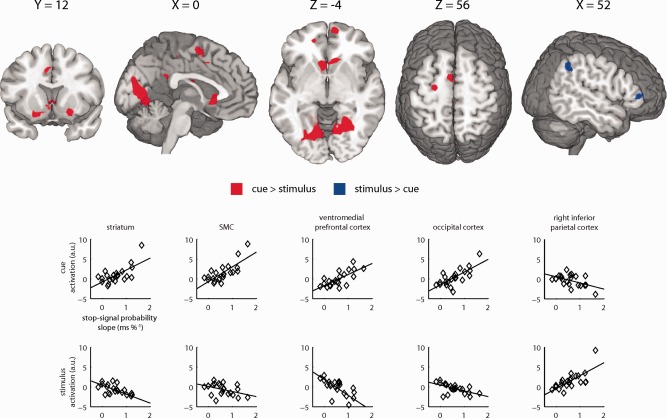
Effect of stop‐signal probability on brain activation in relation to proactive slowing differs between cue and stimulus period. Brain regions shown a significantly stronger positive relationship during the cue than during the stimulus period increase in activation as a function of stop‐signal probability during the cue versus stimulus period on go trials (red) or during the stimulus period on go trials versus the cue (blue). Significant clusters of activation (P < 0.05, FWE‐corrected) are displayed on a normalized brain (neurological orientation, left is left). Scatter graphs are shown to provide a graphical representation of the relation between the behavioral and physiological sensitivity to increasing stop‐signal probability during the cue (top row) and during the stimulus period on go trials (bottom row). [Color figure can be viewed in the online issue, which is available at http://wileyonlinelibrary.com.]