
Figure 3.
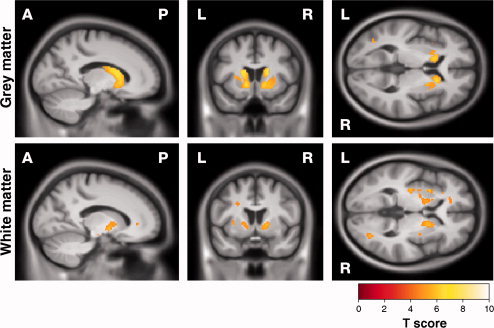
SPM showing correlations between increased anti‐saccade error rate and reduction in (top) GM and (bottom) WM. Results are shown overlaid on a mean customised template at P < 0.05, corrected for multiple comparisons using familywise error. [Color figure can be viewed in the online issue, which is available at wileyonlinelibrary.com.]