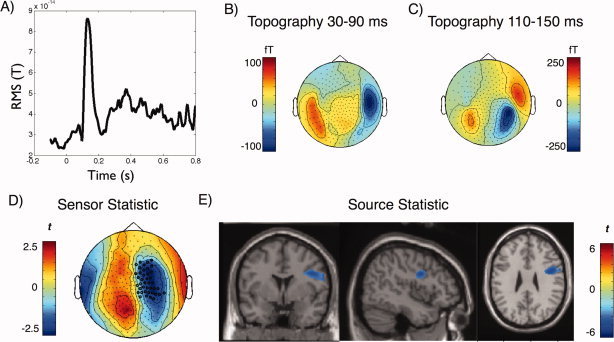
Figure 3.

ERF results. A) Average (RMS) time‐course of the ERF over all conditions (target onset at 0 ms), and corresponding topographies of the B) middle latency and C) N1 periods. D) A significant negative cluster was identified between 30 and 90 ms at right frontocentral sensors when the cue‐target combination was presented to the left ear, indicating a stronger relative negativity when the preceding cue was informative as compared with when it was uninformative. E) Analogous statistical contrast as in D) on source level shows relatively weaker activity in right IFG in the informative condition as compared with the uninformative condition. [Color figure can be viewed in the online issue, which is available at wileyonlinelibrary.com.]
