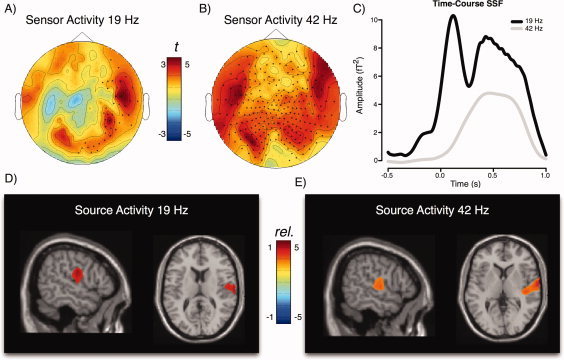
Figure 4.

Basic aSSR characteristics (“Emergence”). Topographic representations of the A) 19 Hz aSSR and B) 42 Hz aSSR. Colors represent statistical (t) values as compared with the precue baseline averaged over 200 to 800 ms postonset of the compound sound. For the 19 Hz AM tone, aSSR are strongly right lateralized, whereas bilateral responses can be seen for the 42 Hz aSSR. Please note that the topographies do not contain polarity information, since they are lost due to our analysis of the aSSR in the time‐frequency domain. C) Time‐courses of the 19 and 42 Hz aSSR extracted from the time‐frequency representation of the unfiltered evoked field. Sustained aSSR activity starts ∼250 ms poststimulus onset and falling off rapidly after stimulus offset. The 19 Hz AM sound additionally elicited a strong transient response in the P1/N1 time‐window. Results of source localization of the D) 19 Hz and E) 42 Hz aSSR for the 200 to 800 ms period (compared with precue baseline). Colors correspond to relative changes (1 = 100% increase relative to baseline). Figures are masked at P < 0.01 and indicate strongly right‐lateralized responses. The 42 Hz aSSR includes regions of the primary auditory cortex. For the 42 Hz aSSR, an additional left source was seen in the left hemisphere at a more liberal masking level, however slightly superior to auditory cortex (see Supp. Info.). [Color figure can be viewed in the online issue, which is available at wileyonlinelibrary.com.]
