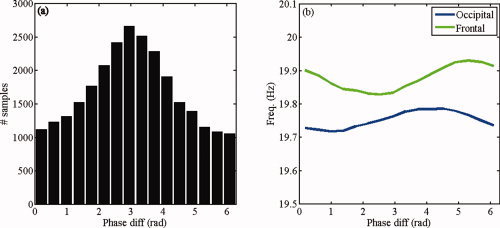
Figure 11.

Group average results in the beta band. (a) Observed distribution of phase differences in the beta band (17–23 Hz) averaged over all subjects. (b) Estimated modulation functions averaged over all subjects. [Color figure can be viewed in the online issue, which is available at wileyonlinelibrary.com.]
