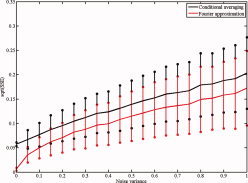
Figure B1.

Performance as a function of noise intensity. Shown are the square root of the sum of squared errors (SSE) as a function of noise variance for both methods. The black and red curves denote the square root of the sum of squared errors (SSE). The vertical bars with circles denote one standard deviation (based on 1,000 simulations). [Color figure can be viewed in the online issue, which is available at wileyonlinelibrary.com.]
