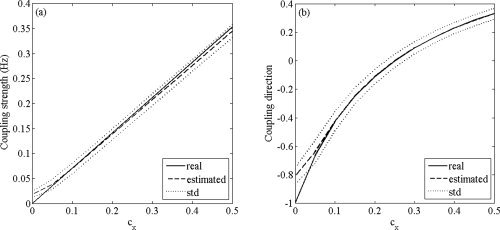
Figure 3.

Estimation of strength and direction in coupling. (a) True and estimated coupling strength as function of c x. (b) True and estimated coupling direction as function of c x. In (a) and (b), the solid lines denote the true values of coupling strength and direction, respectively, the dashed lines denote the estimated values, and the dotted lines denote one standard deviation above and below the estimated values (based on 1,000 simulations).
