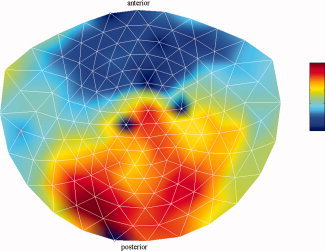
Figure 5.

Mean frequencies of spontaneous alpha oscillations. Shown is the mean instantaneous frequency in the alpha band (7–13 Hz) per channel and averaged over the 2‐min recording time and over all subjects. The color bar ranges from 9.2 to 11.0 Hz. The four white dots represent bad channels and were excluded from the analysis. [Color figure can be viewed in the online issue, which is available at wileyonlinelibrary.com.]
