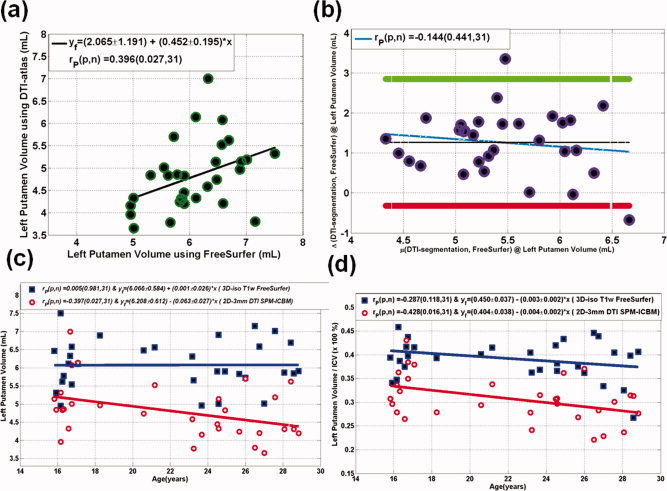
Figure 2.

Comparison of DTI‐segmentation and FreeSurfer volume estimation on the left putamen volume on the N = 31 sample. (a) A scatter plot along with the linear regression analysis, (b) a bias analysis using the Bland–Altman method, (c) scatter plots and regression analysis of the dependency of the estimated left putamen volume on age, and (d) scatter plots and regression analysis of the scatter plots and regression analysis of the dependency of the estimated left putamen volume on age. [Color figure can be viewed in the online issue, which is available at wileyonlinelibrary.com.]
