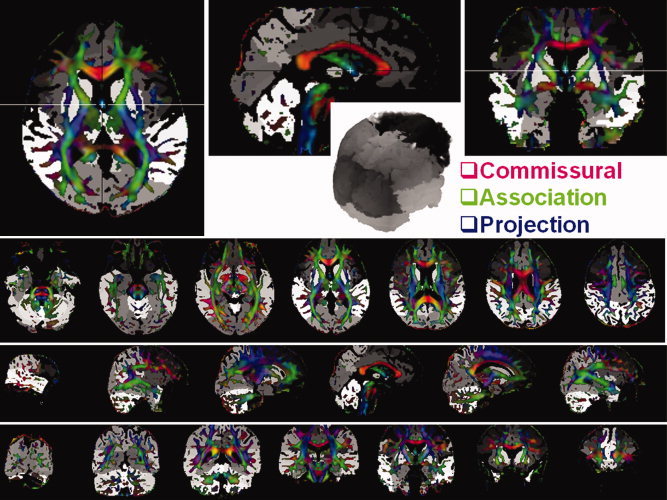
Figure 4.

Illustration of the application of DTI‐based segmentation of gray matter volumes to build a teaching brain digital atlas and to improve the accuracy of quantitative DTI measurements (e.g., fiber tracking and region‐of‐interest). The figure shows in 3D multiplanar views a fusion of color‐coded and FA‐modulated principal eigenvector map with the regional gray matter volume segmentation also shown in 3D. The different shades of gray correspond to deep subcortical and lobar regions while red is assigned to commissural fibers oriented right‐to‐left (e.g. corpus callosum), green is assigned to association fibers oriented anterior‐to‐posterior (e.g. cingulum), and blue is assigned to projection pathways oriented superior‐to‐inferior (e.g. corticospinal tract).
