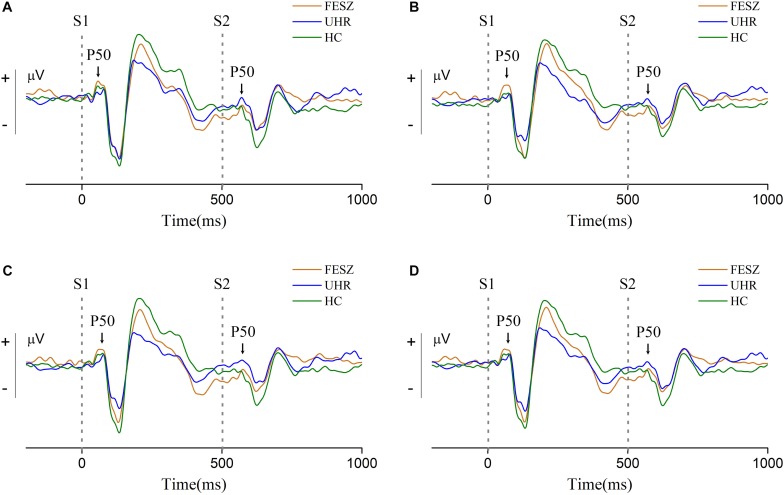
FIGURE 2.
Grand-average event-related potential waveforms at sites 6, 7, and 106 around Cz (site 7 is located at the upper left of the adjacent Cz, site 106 at the upper right, and site 6 is located above the middle of sites 7 and 106. The distribution of all electrodes is shown in the Supplementary Figure 1). (A–C) shows the grand-average event-related potential waveforms of sites 6, 7, and 106, respectively, and (D) shows their sum. Two gray dotted lines in each subgraph represent stimulus 1 (S1) and stimulus 2 (S2) respectively. The S1 and S2 component of P50 are indicated with arrowheads. In each subgraph, the orange line represents FESZ, the blue line represents UHR, and the green line represents HC.

