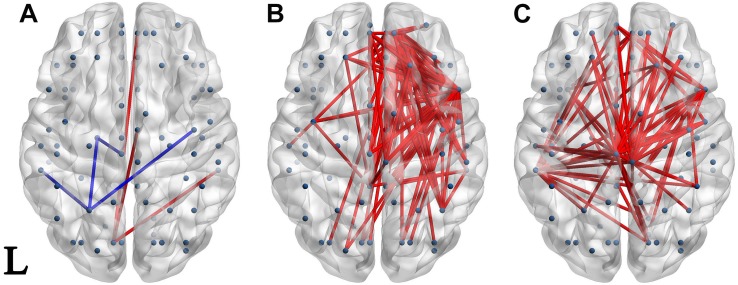
FIGURE 4.
Network of significantly different connectivities in the three groups from the S1-S2 ERP waveform. Significantly different connectivities in the three groups are shown: (A) FESZ vs. UHR; (B) FESZ vs. HC; (C) UHR vs. HC. A blue (red) line represents significantly lower (higher) connectivity in the first group compared with the second. For example, the blue lines in (A) indicates lower connectivities of FESZ compared with UHR. The connectivities was displayed by BrainNet Viewer (http://www.nitrc.org/projects/bnv/).

