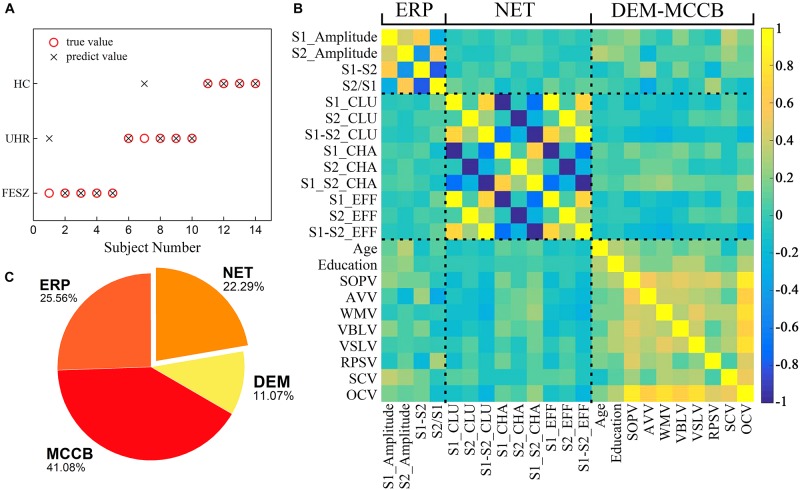
FIGURE 5.
A series of results from one of the classification with ERP, MCCB, DEM and NET as input features including (A) Predictions of the third stage decision tree classifier including all 24 features as inputs. The abscissa represents 14 subjects for which the group was predicted. Black crosses represent predicted values and red circles show the true values. (B) Pearson correlation matrix between the features used in the final classifier. A total of 24 features from left to right of the x-axis are divided into 4 classes: P50 ERP behavior (including S1_Amplitude, S2_Amplitude, S1-S2 and S2/S1), brain network parameters (S1_CLU, S2_CLU, S1_S2_CLU, S1_CHA, S2_CHA, S1_S2_CHA, S1_EFF, S2_EFF and S1_S2_EFF), demographic data (gender, age and education), and MCCB (SOPV, AVV, WMV, VBLV, VSLV, RPSV, SCV and OCV). CLU: clustering coefficient; CHA: characteristic path length; EFF: efficiency. SOPV: speed of processing; AVV: attention/vigilance; WMV1: working memory; VBLV: verbal learning; VSLV: visual learning; RPSV: reasoning and problem solving; SCV: social cognition; OCV: Overall composite. The rightmost color bar from deep blue to light yellow represents a gradient from −1 to 1 in correlation. (C) A pie chart revealing the importance of the four types features. The features represented by each color and its proportions are shown in the figure.

