
Figure 1.
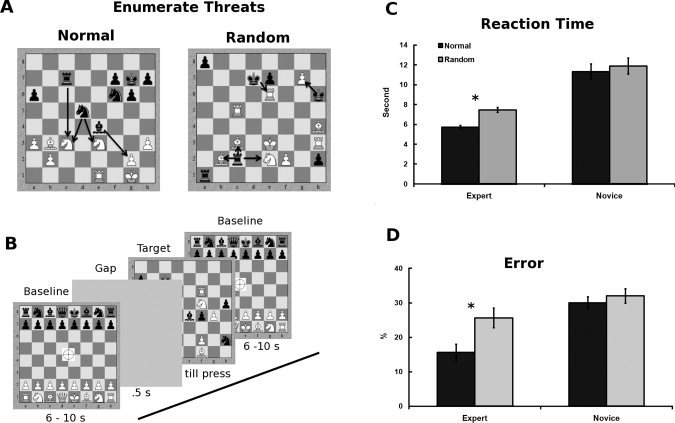
Design and reaction time data. A: The stimuli used in the task. Participants had to indicate whether the number of Black threats (how many times Black can take White) was four. Left side presents normal positions taken from masters games unknown to participants; right side depicts random positions obtained by distributing pieces randomly on the board. The relations are highlighted by lines between the encircled objects—not seen by participants. B: Trial structure. Baseline stimulus was an initial chess board configuration with a fixation cross; its duration was jittered. A gap in stimulus presentation was used as a warning about the upcoming stimulus. The actual chess stimulus (normal and random positions) was then presented. After the players indicated their answers by pressing one of the response buttons, the baseline stimulus of the next trial was presented. C: Time (in seconds) experts and novices took to complete the task depending on the type of position. D: Errors (in percentage) experts and novices make while completing the chess and control tasks depending on the type of position. Blue color represents experts; red color novices. Error bars indicate the standard error of the mean (SEM). *P < 0.01 in a t‐test for dependent samples.