
Figure 2.
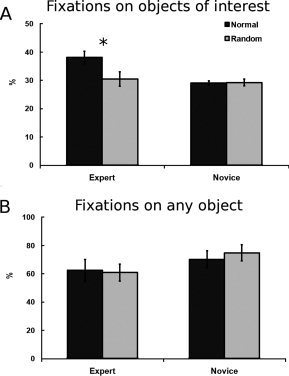
Eye movement data. A: The average percentage of fixations on the objects of interest for experts and novices on normal and random positions across the whole trial. B: The average percentage of fixations on any objects irrespective of interest for experts and novices on normal and random positions across the whole trial. Blue color represents experts; red color novices. Error bars indicate SEM. *P < 0.01 in a t‐test for dependent samples.