
Figure 3.
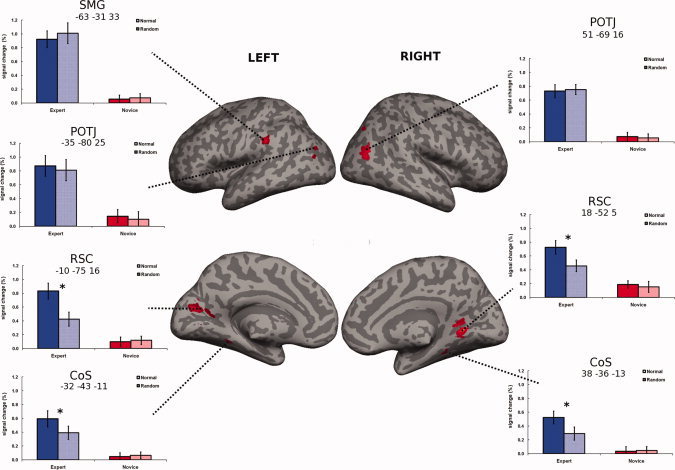
Neuroimaging data (expertise effect). Brain regions more activated in experts than in novices (main effect of expertise; P < 0.05; FWE‐corrected; k = 5), presented on an inflated brain. SMG, supramarginal gyrus; POTJ, parieto‐occipito‐temporal junction; RSC, retrosplenial cortex; CoS, collateral sulcus. The MNI coordinates are presented below the ROI labels. Percent signal change (relative to starting position/baseline) from the most activated voxel in each of the regions was extracted and plotted for descriptive purposes. Blue color represents experts; red color novices. Error bars indicate SEM. *P < 0.01 in a t‐test for dependent samples.