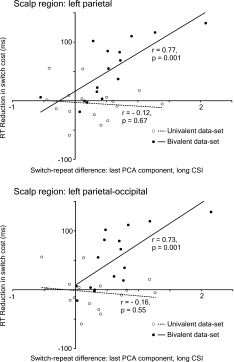
Figure 5.

The correlation between the switch‐repeat difference in the scores of the PCA component that comprised the late posterior switch‐induced positivity in the CSI (peaking at ∼700 ms in Fig. 1B) and the reduction in the RT switch cost in the long CSI relative to the short CSI. The correlation (run separately for the bivalent and univalent data‐sets) is shown for the two posterior scalp regions where it was statistically significant in the bivalent data‐set.
